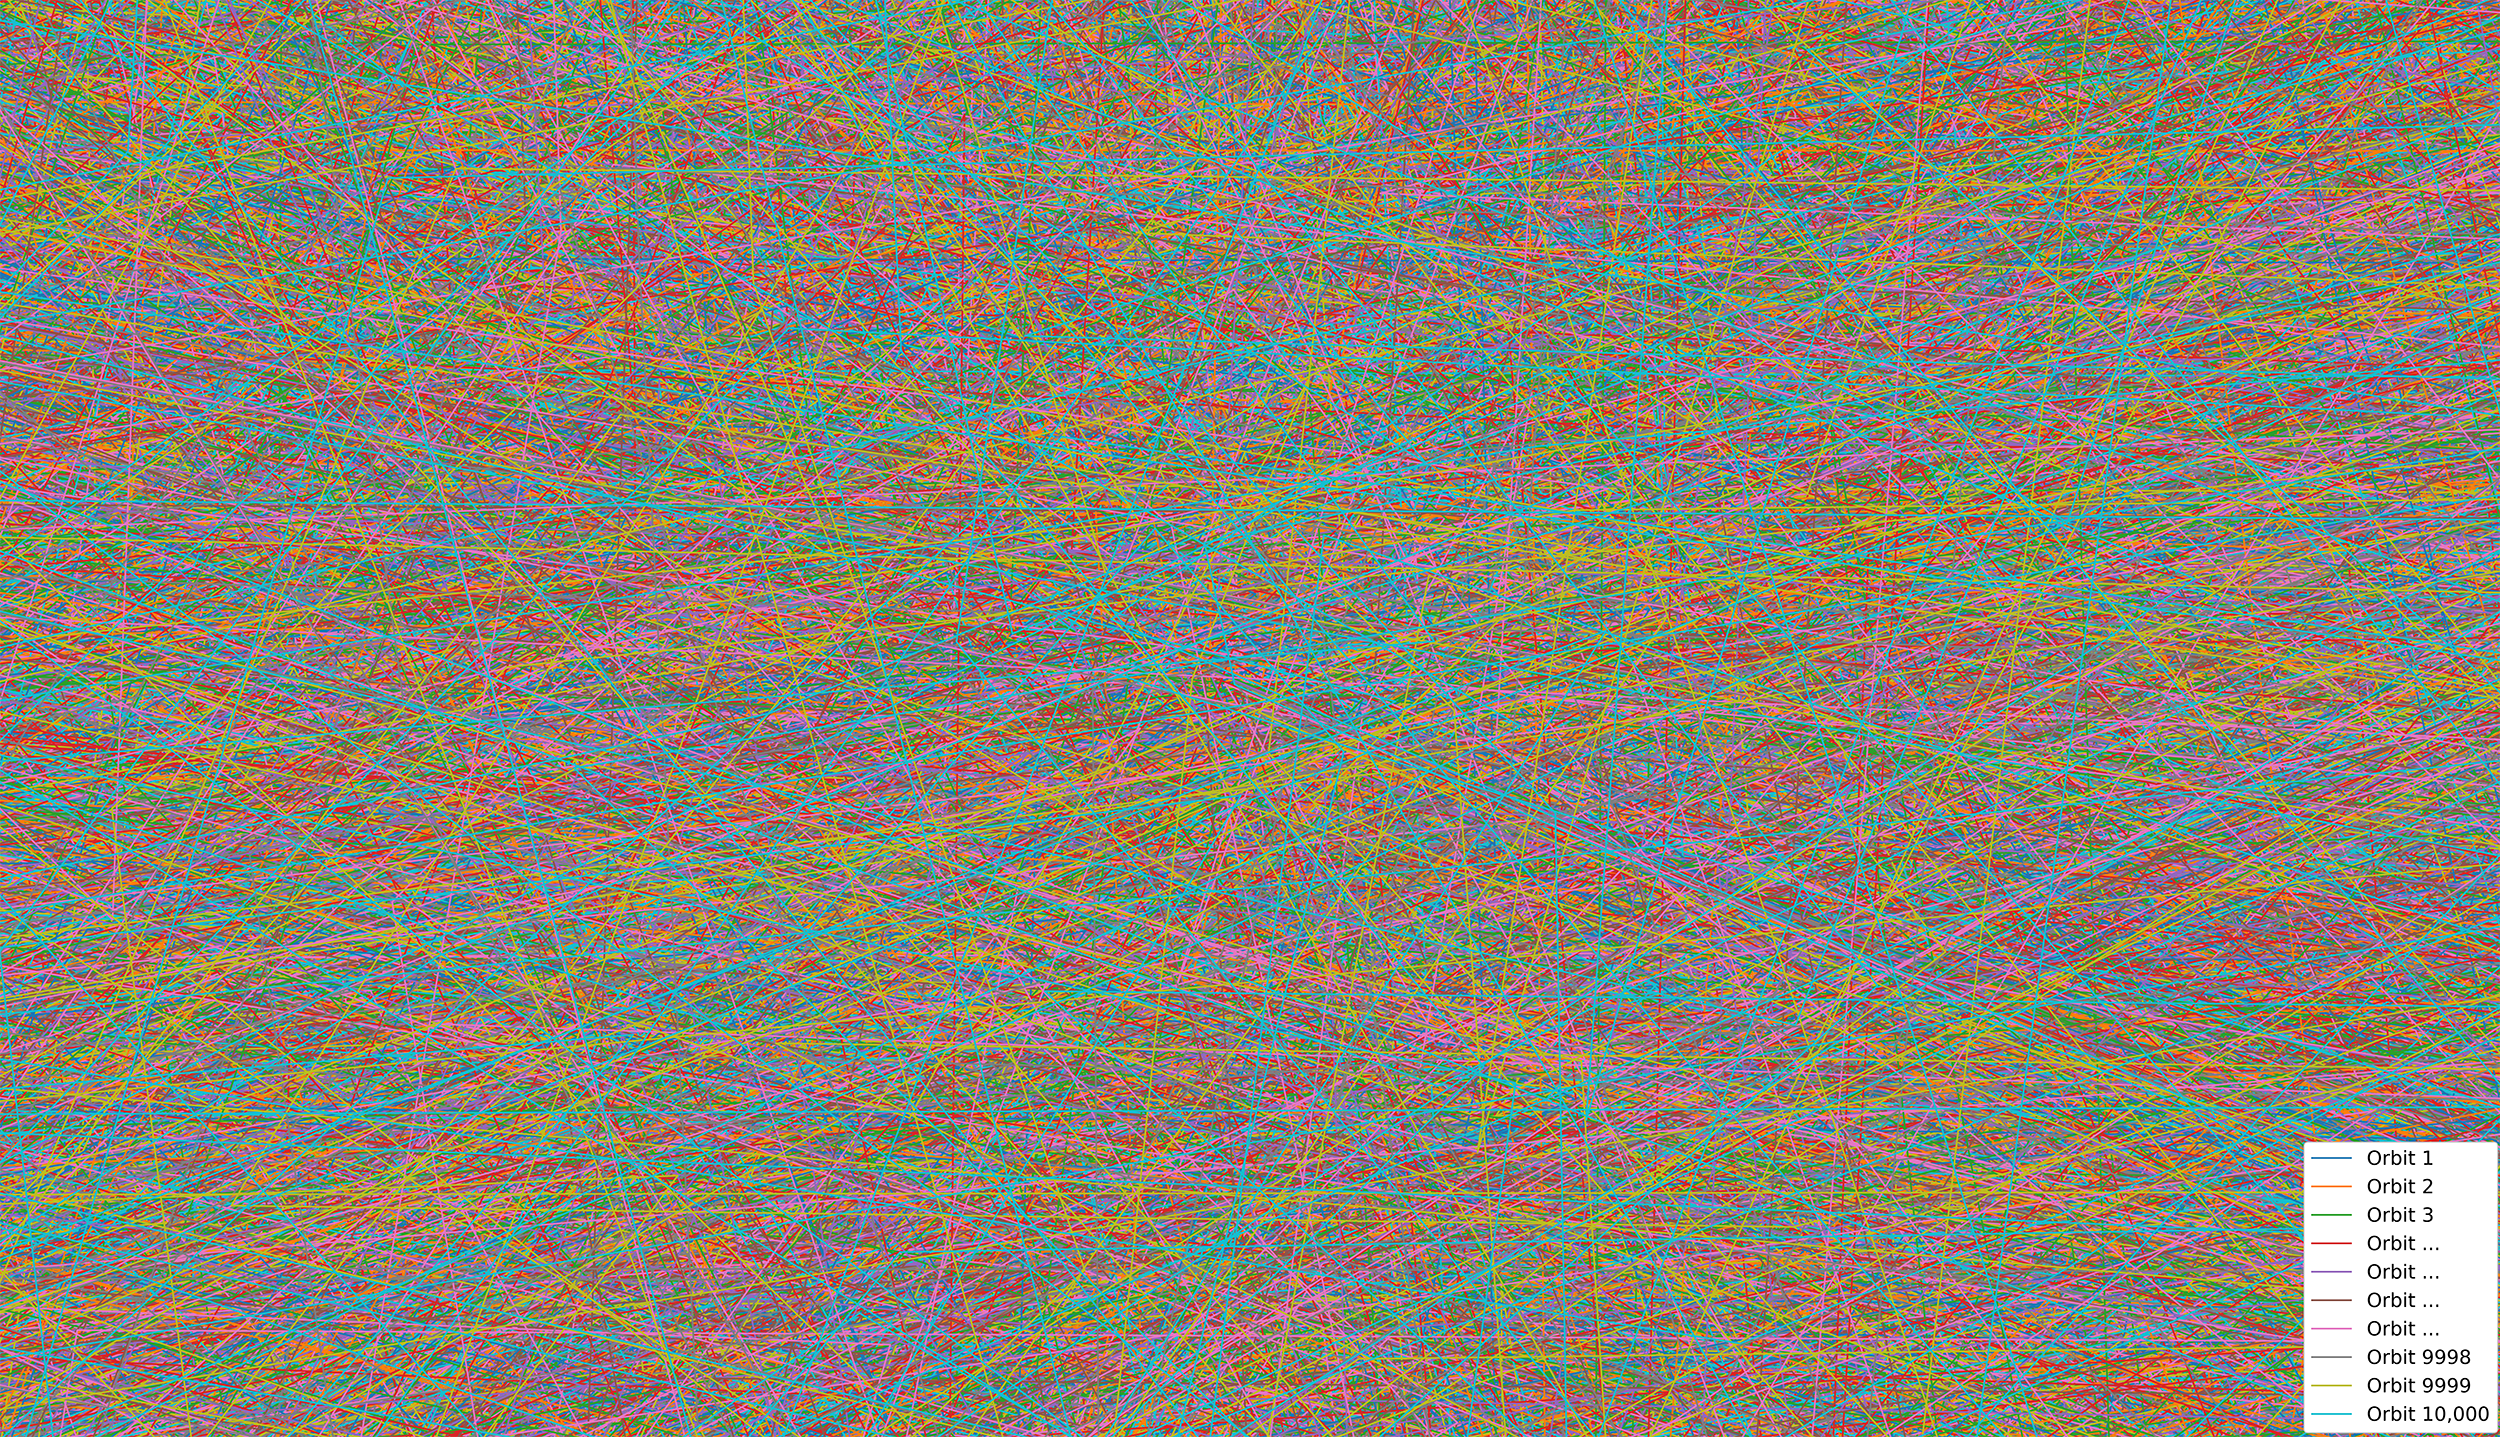
Description: Professor Jeremy Webb and I were a couple months into studying the effects that inter-galactic clumps of dark matter (dark matter subhalos) have on simulated orbits with Python 3 simulations when this image was produced. Our hypothesis was: if simulated orbits evolve in an environment that hosts orbiting dark matter subhalos, then the simulated orbits should change because of gravitational influences from the dark matter subhalos. When preforming a sanity check of our progress, plotting the subhalo orbits of a steppingstone simulation of 10,000 low-mass dark matter subhalos, I noticed the centre of the simulation domain to be completely filled with orbital paths. The plotting program that was used to create it randomly assigned colors to all 10,000 orbits, an action usually done so that different plot lines are automatically differentiable from each other when viewing. As a result, in the centre of our simulation where subhalos are the most abundant and their orbits overlap, a beautiful chaos was created. This image was an accidental by-product of our research.
Why did you conduct this research? This research was conducted during the thesis of my Physics and Astronomy Specialist undergraduate program. My thesis quantified the effects that simulated dark matter subhalos have on theoretical orbits, explored how these orbital effects could influence real star clusters like globular clusters of our Milky Way galaxy, and serves as the first step in creating a new way in which we can determine properties of dark matter within our galaxy.
Technique: Python 3 was the language that all simulations ran through, GALPY, a python galactic dynamics package, was crucial in initializing and running all simulations, and the Python plotting library matplotlib was generated the plot.
Acknowledgements: I’d like to acknowledge Prof. Jeremy Webb for being a superb thesis advisor.

